For the past few years, China has surpassed Japan and become the world’s 2nd largest market in the total consumption of cosmetics products just after the US. Moreover, L2inc, a business intelligence firm predicts that China will become the largest market of cosmetics products in 2020. Meanwhile, with the quality of consumers’ lives improving, mid-to-high end cosmetics are becoming increasingly popular.
As one of the largest cosmetics markets in the world, new domestic brands keep emerging and piles of international brands contends to swarm into the China market. In order to ensure the quality of products and protect the legitimate rights and interests of consumers, CFDA puts its largest efforts ever in the supervision of the cosmetics industry.
Given all this, combined with the market’s latest development and statistical data upon supervision, CIRS comes with an intuitive and comprehensive analysis of the development of cosmetics industry.
1. Market Scale and Growing Trends
1.1 Overall Industry Continues to Grow
From 2013 to 2016, the total volumes of retail sales of cosmetics continued to increase, with ¥162.5 billion, ¥182.5 billion, ¥204.9 billion and ¥222.2 billion respectively.
By analyzing the moving trend of the year-on-year growth rate of the country’s cosmetics retail sales from January to December 2016, it can be concluded that although there were a few unfulfilling growth rates for certain months, the overall annual sales volume kept increasing. The bottom point of only 4% year-on-year growth rate in 2016 occurred in October. However, with the resumption of the growing rate in the coming months, the retail sales reached ¥22.7 billion in December with the year-on-year growth rate of 11.0%. Consumers’ interests in purchasing are greatly influenced by sales promotions in stores, online platforms and by brand owner companies. Their promotional events in certain periods lead to the unstable monthly growing rates.
According to the Related Analysis of the National Economy published by National Bureau of Statistics in April 2017, the total retail sales from January to April 2017 is ¥78.5 billion with a year-on-year growth rate of 9.4%, higher than the annual growth rate of 8.44% in 2016.
Table 1, Moving Trend of Growth Rate of Cosmetics Retail Sales, January to December, 2016.
Data Source: National Bureau of Statistics; Analyzed by CIRS.
Month | 1-2 | 3 | 4 | 5 | 6 | 7 | 8 | 9 | 10 | 11 | 12 |
Year-on-Year Growth Rate | 11.4% | 9.2% | 7.6% | 5.9% | 7.9% | 9.0% | 5.8% | 7.7% | 4.0% | 8.1% | 11.0% |
1.2 Revolutionary Change on Sales Channels
The major sales channels for cosmetics are supermarkets, department stores, cosmetics chain stores and online platforms. Cosmetics sales through supermarkets and department stores are still in the dominant position in recent years, however, the scales of the market through chain stores and online platforms are becoming increasingly larger.

Figure 1, Comparison between Different Sales Channels for Cosmetics in 2010 and 2015.
Data Source: China Industrial Information Network; Analyzed by CIRS.
In 2016, the growth rates of cosmetics sales through department stores (skin care and make-ups) and supermarkets (daily care products) are -0.9% and -0.6% respectively. However, the growth rate through cosmetics chain stores (daily care products) has a clear increase of 9.2%, and for online platforms the increase was dramatic of 40%.
Online trading has incomparable geographical and spatial advantages that traditional retail can hardly possess, plus the fact that young buyers are praising highly on online-purchasing these days, the dramatic increase in cosmetic sales through online platforms has then automatically emerged. Cross border e-commerce platforms which developed rapidly due to the low price barrier, have also contributed greatly to the online trading market. From the regional distribution of cosmetics online purchasing, 77% is contributed by the mid-class population in top and 2nd tier cities.
1.3 Increase Market Scale of Import Products vs Slight Decrease for Domestic Products
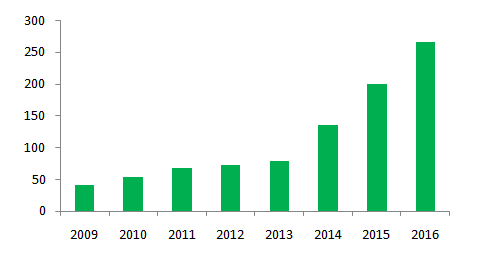
As one of the largest cosmetics consuming countries with extremely large population base, more and more foreign companies start getting their products into the China market. Furthermore, the cut in cosmetics import tariff has also favored their needs to import products to China. The increasing number of import products increase choices of consumers. Mid-to-high end cosmetics products are highly pursued by the younger generation, which further stimulates the market for import products.

Figure 2, Amount of cosmetics imports (by 100 million RMB) from 2009 to 2016
Data source: Foresight Industry Research Institute; Analyzed by CIRS.
Compared to the rapid growth of the import market, the development on domestic market are experiencing a declining tendency, as popular foreign brands keep swarming into China and the fact that domestic products are trapped into traditional sales channels. Several domestic cosmetics giants started to face downward pressure on profit. In addition, most domestic small and medium-sized brand companies are lack of independent R&D ability and unclear market positioning, which have greatly influenced the quality of domestic products.
1.4 Rapid Growth for the Baby Care Market
More than 15 million infants are born in China annually in recent years, and hundreds of billions are spent on baby care products each year. Data shows that the market volume for 0-3 year old baby care products has reached ¥7 billion in 2016, and the figure is predicted to be more than ¥15 billion in 2020, with the CAGR of 20%.
Table 2, The market volume of 0-3 year old baby care products from 2015 to 2021
Data source: Mintel; Analyzed by CIRS.
Year | 2014 | 2015 | 2016 | 2017 | 2018 | 2019 | 2020 |
Market Volume (by 100 Million) | 55 | 59 | 70 | 88 | 109 | 131 | 154 |
2. Industry Supervision
2.1 Supervision on Cosmetics Manufacturing
On 15th December 2015, CFDA issued the Work Specifications on Cosmetics Production Permit and Checking Points on Cosmetics Production Permit. The ‘Checking Points’ provides specific requirements on different aspects including on institutions and workers, quality control, factory and facilities, equipment, materials and products, production control, verification, product distribution, customer complaints, adverse effects and product recall. It is said to be the China Cosmetics Good Manufacturing Practices.
From 1st January 2016, any newly established cosmetics manufacturer can apply to the local provincial FDA for production license. Provincial FDA shall audit the manufacturing company according to the ‘Specifications’ and issue the Production License to qualified manufacturers.
2.2 Current Status of Cosmetics Administrative Approval
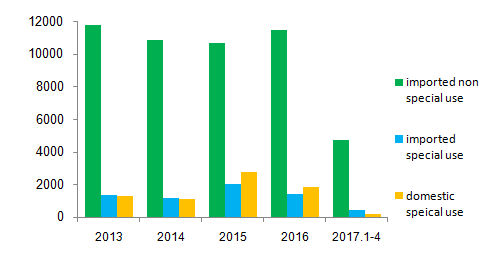
In 2016, there are over 11,000 import non-special use cosmetics products, 1,400 import special use products, 1,800 domestic special use products approved by CFDA and 303,700 domestic non-special use cosmetics products recorded at provincial FDAs. Compared with imported non special use cosmetics, less special use cosmetics are approved by CFDA as result of more registration requirements for functional ingredients.
At the end of 2013, CFDA issued the Notice on Adjusting the Management of Cosmetics Registration and Record-Keeping. The notice stated that whitening products are in the scope of anti-freckle products. The transition time for this adjustment was valid until 30th June 2015. Therefore a significant increase of the applications of special use cosmetics products has emerged since 2015.

Figure 3, Data summary of approval import non special use and special use cosmetics from 2013 to 2017
Data Source: CFDA Official Website; Analyzed by CIRS.
From January to April 2017, CFDA has approved about 5,000 import cosmetics and 160 domestic special use products. 31st December 2016 is the expiration date of changing or renewing production license. Moreover, the Technical Safety Standards for Cosmetics (Please click here for more information about the Technical Safety Standards for Cosmetics) was implemented at the same time in December. Most domestic manufacturing companies are experiencing transitional period, causing the significant decrease in the number of applications.
2.3 Market Supervision
In 2016, CFDA has carried out several tests for randomly selected commercially available cosmetics and has paid significant higher attention on sun-blocks, masks and products for anti-acne and anti-freckle compared to other products. In the first quarter of 2017, local FDAs have drawn up the work points on the post-market supervision of cosmetics in many cities and regions. The points are all aimed at monitoring the quality of products, and hence protect the legitimate rights and interests of consumers.
On 1st March 2017, the pilot record-keeping system in Shanghai Pudong New Area has implemented for import non-special use cosmetics. The new system has altered the way of product management from pre-market approval to on- or post- market surveillance. And the on- or post-market surveillance under the new record-keeping system will certainly be much more stringent.
If you have any other needs or questions, please contact us at service@cirs-group.com.

